Google Earth Network Route Imaging
Global Crossing's Pan-European duct and fibre network was constructed during 1999 and 2000. It may be hard to believe, but at that time, the Google search engine just came out of the dorm room for beta testing, and digital camera's were using floppy disks (Whatever these were: Ask your grandparents) for storage.
Even though our fibre and wavelength-based IP network will continue to be state-of-the art for many years -- avoiding the horror scenarios related to IP/VOIP conversion and convergence problems that legacy networks have -- this does not mean that there are no improvements to be made to stay aligned with new technology.
One of my Operations "hobby" projects is to display the GC network using web-based tools such as Google Earth. Both Carrier and Enterprise customers demand precise geographic information to avoid single-point-of-failures. They further need to have detailed map information for their support staff and suppliers to reach GC network locations for repairs and transport systems upgrades.
Mapping 25,000 km of underground duct and cable systems is not an easy thing to do: The diversity of the European continent (our home-built fibre network runs through twelve countries) has resulted in multiple non-aligned country or even regional grid coordinate systems. Some used a key city as reference point, others used a meridian, or any other arbitrarily selected location. As long as there were no border-crossing network activities, this perspective was not an issue, and it would not have been an issue at all, if GPS and Google hadn't taken over the world.
 Merging all vector-based (AutoCAD) network design data into a single view thus required the mapping of dozens of disparate regional grids into one, earth-centered, GPS coordinate system: A cumbersome process requiring many (non-) linear translations [Kudos to our wiz-kid Nivaldo!].
At that point, the network data is ready for use in systems like Google Earth or Yahoo Maps.
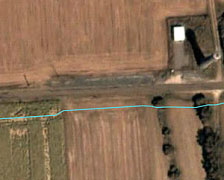
The result is remarkable: This image was created as overlay of our duct route near one of our Northern France amplifier sites on Google Earth.
It was shot after zooming in to an approximate altitude of 600 m (2000 ft). Next to the blue line displaying our duct route as converted from AutoCAD, the original trench dig is still visible from this satellite image, even though the route was completed seven years ago. The image further shows that, after conversion, an accuracy of a few meters is quite feasible. The amplifier station is the white building on the top-right hand side, next to an old chimney (station access lines are not shown here).
Our fibre customers are pleased: Not only can they trace the exact location of their network, but their families can also see where daddy or mommy will be for their provisioning or system commissioning activities, and they can check out nearby tourist sites using tools like Panoramio (acquired by Google last month).
Bringing historic data in line with today's technology effectively means: Staying behind. Our task is to stay ahead, so we're now working to link the web-enabled network data into an image and connection database repository, allowing both ourselves and our customers a detailed virtual and real-life perspective of routes, sites and buildings, space, footprints, equipment, and most important for a carrier: All fiber allocations and (meet-me) interconnections at distribution frames.
I expect to get a first version ready for beta testing out of the dorm room in the next few months. Once complete, this solution will hopefully last for at least another few years (or until the next Google Earth software upgrade...).
So what's the next advancement, you may ask? My best bet: Operate our virtual network on Second Life.
Gert Nieveld July 4, 2007